


For a class assignment, I had to create a visual encoding system for the National Parks system. Using ten different parks, I wanted to create an approachable visualization that contained relevant information for potential visitors.
Inspired by projects like Frederica Fragapane’s Planet Earth and Studio Terp’s Carbon Tax, I collected data on each park and used illustration (which is outside my comfort zone!) for my information visualization.
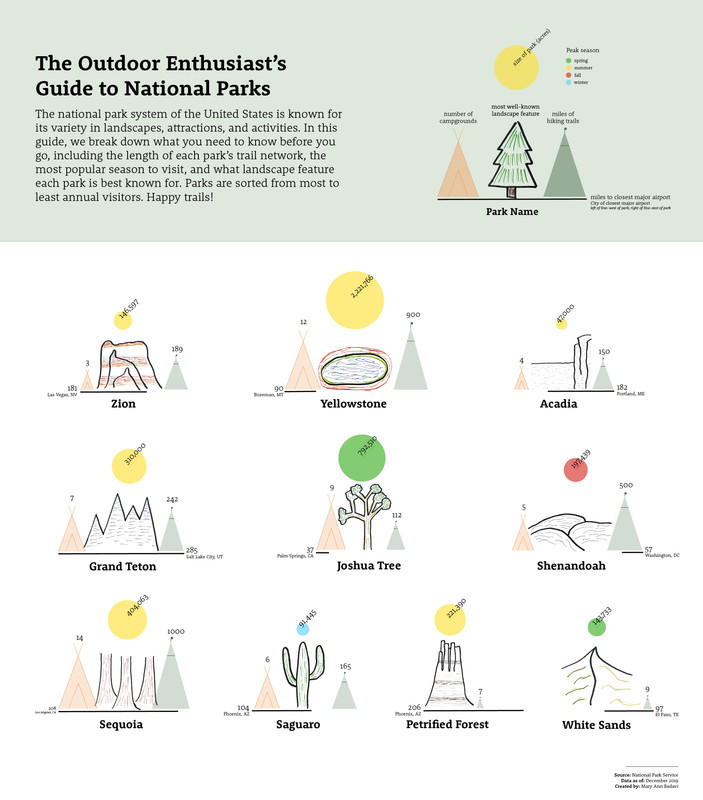
I thought about information I would want to know if I was visiting a park: what kinds of hikes there were, where I could camp, how far a drive it would be, size of the park, etc. These were the encodings I chose to visualize, after I was able to cross-check on the National Parks websites that that data was available.
While the data was available, not all of it was consistent. For example, some parks mentioned how many miles of hiking trails there were, while others simply included a list of available hikes. I ended up having to add up hiking mileage for several of the parks I chose to ensure the metrics were the same.
At first I thought I would do the whole thing graphically, and perhaps use iconography from the Noun Project for each of the landscapes, but I couldn’t find a consistent look and feel (and some of the landscapes—like hoodoos!—weren’t easy to find). I found myself really just wanting to draw them, illustration skills be damned. So I created a simple style using my fineliner pens to color in the outline of different types of landscape.
When it came to merging together the digital and illustration-based components of each visualization, I struggled a bit to figure out how to make it work. I ended up using a muted color palette for the digital components to highlight the illustrations more.